In today’s business environment, data-driven decision making is a must. The aggity analytics dashboard, which unlocks crucial insights from enterprise data, is key in different areas of the organization and is an invaluable resource for digital transformation, business and operations managers, and sustainability officers.
Optimize your decisions with our Analytical Dashboard
Business performance is measured based on different factors, but it is clear that, today, this performance is marked by the good use of the data that an organization has and that will allow it to make the right decisions aimed at driving growth.
What is an analytical dashboard?
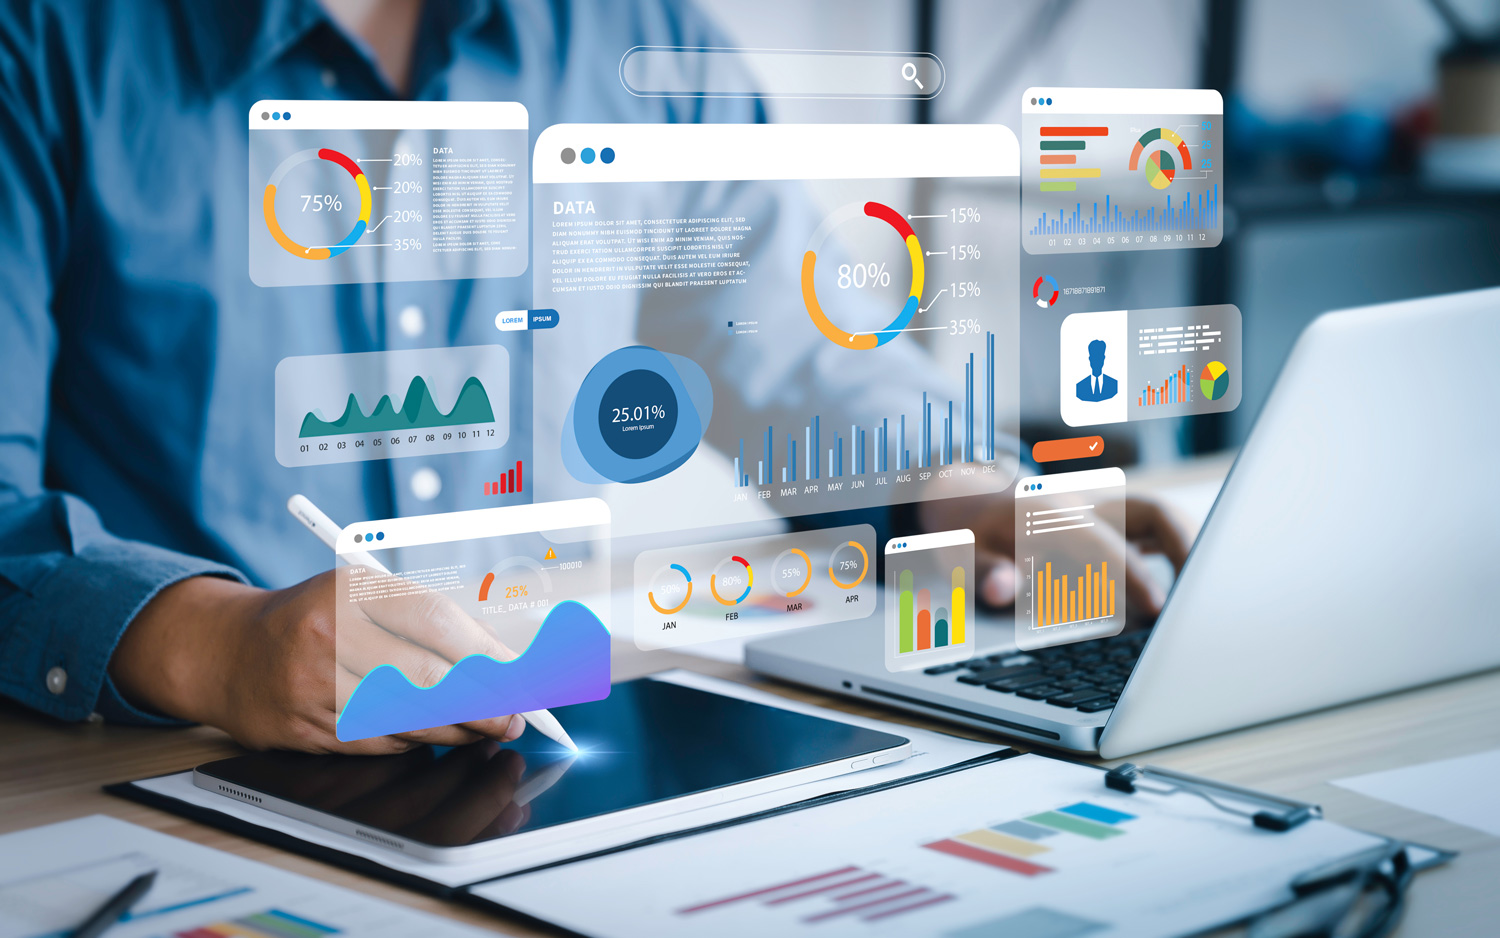
An analytical dashboard is traditionally referred to as a control panel. These solutions provide clear and concise visualization of data and indicators. It can provide, among many other variables, a framework for visualizing performance metrics, financial and accounting data, KPIs, sales statistics or trend analysis.
One of the great benefits of these types of Business Analytics tools is that they offer real-time monitoring, providing a clear view of the moment so that an organization’s decision makers can make data-driven decisions almost immediately. Another great advantage of these dashboards is that they provide the information in a very clear way through interactive graphs, maps, metrics dashboards and other very visual elements to make the information easy to understand.

Importance of dashboards in Business Analytics
These business intelligence tools are increasingly used in different sectors of activity, ranging from industry, retail, healthcare or public administrations, as they allow quick and accurate decision making, predictive analysis predictive analytics identify opportunities or communicate information in an effective way.
Thus, for example, they are used in transportation to optimize routes, in education to identify improvements that can be implemented in curricula, in healthcare to find bottlenecks in medical care or in HR to identify points of improvement that allow talent retention.
Steps to create an effective dashboard
But not all analytical dashboards provide the information the company needs and are therefore often ineffective. To take full advantage of the benefits provided by these data analysis tools , it is essential that they are designed appropriately and according to the needs of the company.
For this, it is essential to count on the help of a partner such as aggity, which has a cutting-edge Analytics offering, the Data Labs methodology aimed at boosting analysis in companies and proven experience in the design of analytical dashboards.
Aggity’s proposal, in addition to designing a customized dashboard to meet the unique and specific needs of each organization, it incorporates state-of-the-art technologies such as Machine Learning o Artificial Intelligenceand integrating different sources, eliminating silos of information and allowing the rapid insights generation to facilitate fast and effective decision making.

aggity’s experts create the dashboard by following exactly all the steps that allow the creation of this platform of data visualization The following steps must be taken in order to be successful: definition of objectives and KPIs, selection of the relevant data, selection of the display of key indicators design of the platform and distribution of elements and, finally, testing and optimization of the platform.
Trends and future of dashboards in Business Analytics
Today dashboards are starting to become a fundamental element in the strategy and implementation of Business Intelligence in companies, but the future will be even brighter for improved analytical reporting. With the incorporation of AI and Machine Learning, platforms are achieved that, in addition to displaying data, are capable of analyzing it and providing recommendations.
Conversational dashboards that allow users to ask questions and get answers in natural language are also starting to be used. In this way, business intelligence becomes more accessible to professionals without technical expertise in data analysis.